

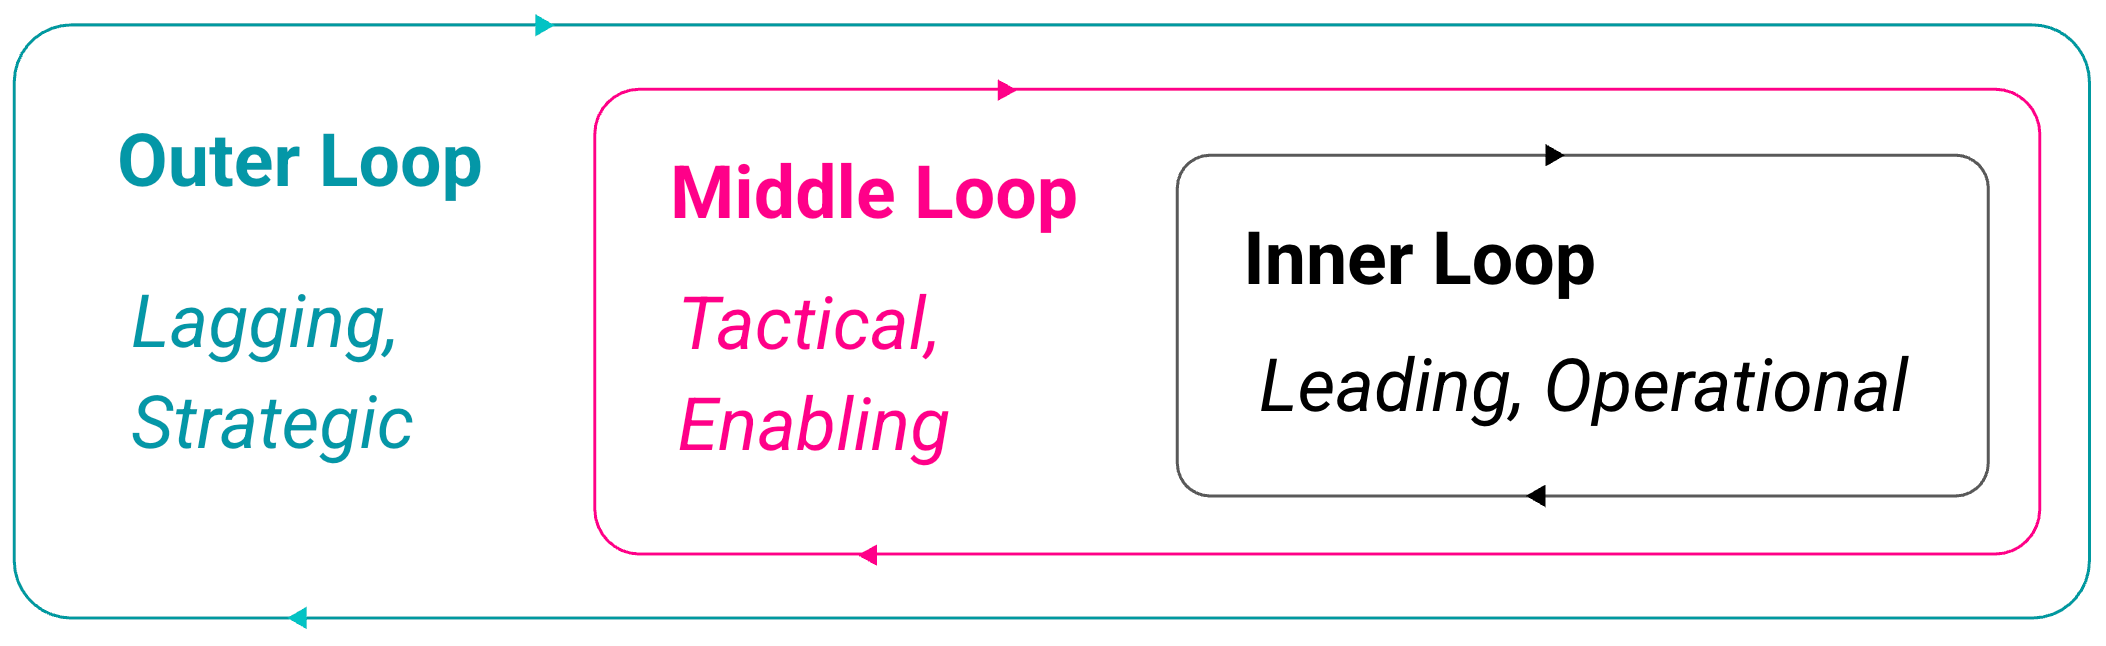
Outer, Middle & Inner loop Flow
Three segments of measurement for a better conversation about metrics

The world of knowledge work and software product development where I spend my time is notoriously difficult to measure, which is why I like to share models that can add some clarity to thinking and communication.
It’s all too tempting to fall victim to the streetlight effect (we often search for things where it’s easiest to see). It leads us to focus on what’s easy to see & measure rather than what leads to value and the outcomes we’re hoping to realize. This often results in measuring things like utilization, efficiency, activity, and outputs rather than effects, outcomes, and value.

Knowing that, one question I hear constantly from clients who struggle to feel confident in their measurement is: “What should we measure?”
I want to make a dent in answering that question, by placing some critical measurement in context. This is more important than ever now that “doing” is trampling “done” in every enterprise I talk to - thanks to generative AI. So much attention is being paid to “inner loop” activities - ignoring the broader needs of the organization. Utilization still dominates much of the attention under the streetlight, especially now that just using AI seems to be a target of many leaders. Busyness isn’t just a bad proxy for progress, it often just gets in the way, distracts you, or sucks up energy you could be using to innovate and problem solve.
In answering “What should we measure?”, the first thing to note is always the ever-frustrating: “It depends.” There’s no getting away from it. This is why we start Flow Engineering with Outcome Mapping. There’s a mountain of things we could and should measure, but what’s most important is always relative, and it should be our focus. Outcome Mapping allows us to distill the possible down to a clear focus. It’s another reason working backwards is so critical. Measurement is a necessary, non-value-added activity. We should be very clear about where, why, what, & how we measure for this reason, and be able to justify how it helps deliver positive results.
In order to more clearly and deliberately measure, it’s been valuable for me to segment measures into different contexts to more effectively communicate what we’re aiming for, and how we can ensure we’re building a cohesive model of measurement. This brings me to the loop model:
Loop Contexts

Key dimensions: strategy/tactics/operations, leading & lagging, operating model implications, working backwards, example metrics, flow & quality vs value/outcomes/impacts and more.
Given this view of the landscape and a target outcome, “What should we measure?” can be formed up by working from the outer loop back to the inner loop. We want to see some global effect, which leads us closer and closer to local activity that will contribute to it. For example:
We want to see revenue rise in a given market segment or product, [outer]
which leads us to performance of the relative products, [outer]
which leads us to our ability to improve those products, [middle]
which leads us to the performance of the teams delivering those products, [inner]
and the teams those products depend on [inner]
The metrics we choose to focus on are the ones we identify as the most strongly correlated with improving performance, ideally associated with our performance constraint.
Metric Examples by Loop

Three reasons this is important today:
Development is not your bottleneck - measuring flow only at the inner loop tells you almost nothing about “getting things done”
Measuring without a clear connection to the outcome you’re aiming for is a recipe for distraction and disorientation
To connect efforts to effects, you need to be able to effectively plot clear connections from what you’re doing to what you’re aiming for
Let’s look at each loop context in further detail:
Outer loop
Lagging, Strategic: Activity happening across portfolios and roadmaps
Cadence: Monthly/Quarterly
Focus: portfolio and business outcomes (months–quarters), allocation and strategic flow.
North Star metric movement and guardrails (e.g., retention, engagement, reliability), OKR attainment and confidence progression.
Customer outcomes (NPS/CSAT/CES), churn/retention, expansion (ARPU/NRR/GRR), revenue and margin per product/value stream.
Portfolio WIP and flow time for epics/capabilities, cost-of-delay realized/avoided, time-to-market for strategic bets.
Investment mix adherence (run/grow/transform), innovation rate, technical debt service ratio, capacity allocation vs actuals.
Program/ART predictability, cross-stream dependency lead time, reliability posture (error budget consumption) at portfolio level.
Key decisions: Funding shifts, capacity allocations, initiative sequencing
Middle loop
Tactical, Enabling: Activity happening within portfolios and value streams
Cadence: Biweekly/Monthly
Focus: product team discovery + delivery (days–weeks), validating bets and delivering predictably.
Hypothesis-to-decision cycle time, experiment velocity, percent of roadmap items validated before build, confidence score at commit.
Adoption/activation of shipped features, time-to-first-value, depth of use (WAU/MAU ratio, retention cohorts), task success rates, UX friction metrics.
Release frequency and batch size, planned vs unplanned work ratio, sprint/PI goal attainment, forecast accuracy, dependency aging and blockage time.
Value stream flow distribution (new features vs defects vs risks vs debt), carryover rate, rework rate, story acceptance latency.
Quality-in-stage (defect containment by environment), regression escape rate, observability coverage for new features.
Key decisions: WIP policies, dependency reduction, batch-size limits, prioritization
Inner loop
Leading, Operational: Activity by individuals within teams
Cadence: Daily/Weekly
Focus: rapid developer/service feedback (minutes–days), optimizing build–test–deploy flow and reliability.
Deployment frequency (per service), lead time for changes (PR open → prod), change failure rate, mean time to recover.
Build success rate, flaky test rate, unit/integration/e2e pass rates, time-to-red/green (TDD cycles), PR review turnaround, merge queue time.
Trunk/branch health (batch size, rebase conflicts), feature flag latency to exposure, rollback/redeploy time, hotfix rate.
Flow time and cycle time per work item, WIP, queue age, flow efficiency, handoff count.
SLO/SLI adherence (availability, latency, error rate), error budget burn, incident frequency/severity, escaped defect rate.
Key decisions: Stop-the-line fixes, swarming to unblock, Kanban WIP updates, test/deploy pipeline repairs
How they connect
Inner loop improves speed and stability, enabling tighter middle-loop experiments and smaller, safer releases.
Think of breathing, heart beat: Autonomic activities
Middle loop translates strategy into validated increments, reducing waste and increasing predictability for outer-loop commitments.
Think of movement, exercise, eating, hygiene: Action & management activities
Outer loop sets outcome targets and investment constraints that shape middle-loop choices and inner-loop standards.
Think of bucket list, investments, work and leisure: Investment & sustainability activities
Each layer is interdependent in different ways: Strategy and vision defines what we invest in, but if we haven’t automated operations, we’ll never get time to execute strategy effectively.
If you can’t breathe you shouldn’t worry about your long term goals. This is why investments in automated testing, pipelines, APIs, interfaces, and integration are critical. If you had to intentionally (manually) breathe, you’d never get a chance to think and act strategically.
Here’s my TL;DR: The right metric at the wrong level is noise; the wrong metric at any level is harm. Anchor strategy (outer loop) to economic outcomes, tactics (middle loop) to flow constraints, and operations (inner loop) to queue health and reliability.
While we’re on the topic, let’s tackle two more questions beyond “what should we measure?” that I think are even more important:
“Why should we measure?” - this may seem obvious, but if you take a moment and think of the answer, it goes deeper than responsibility, knowing what’s going on, and improvement. Measurement has profound impacts on behaviour, culture, incentives, morale, and even satisfaction. Done poorly, it can wreck motivation, and done well, it fuel engagement.
“How should we measure?” - this may seem like it’s included in “what”, but it’s importantly different. Is all the data going to be open and visible across teams? Are we reporting on it at too long or too short a cadence? Should it be privately reviewed or publicly reviewed? Do we prioritize qualitative measures over quantitative? Leading over lagging? Do we have principles or strategy behind our measurement practices? Do we pick a north star and let everyone align in their own way?
As my friend
mentioned on the draft post: “Measuring in a bunch of places without a theory of cause and effect means you are ultimately just trying to make sense of noise.” It’s important that any measurement practice be attached to a systematic view of your organization and ecosystem, with full knowledge of the forces at play when you pick a target, or try to balance several against each other. We work in complex, adaptive systems that don’t lend themselves to simple measurement.What I’ve seen work well in software in tech are a few simple practices, informed by Value, Clarity, and Flow:
Only measure what you’re prepared to act on. If a metric change off trend or target doesn’t result in investigation or action, it’s just noise
Act within a PDSA loop: Plan by setting a target or hypothesis, Do by making a change, Study the effects, Act accordingly and repeat
Measure something you can impact or respond to, and at an interval that you can correlate your actions to effects
Prioritize your measurement based on strategy and needs. If you already have a goal, then focus on that before trying to create a general system of performance measurement. It’s very politically expensive to craft a grand measurement system while results are waiting, and your customers (be they external or internal) are waiting for a single answer or progress on one axis
Avoid using metrics to understand the system or map directly to performance, rather use metrics as additional sensing capabilities, and observe trends considering a broad variety of conditions (staffing, seasonality, etc)
Rather than trying to balance a complicated combination of metrics, choose a north star for each loosely coupled domain and let the organization navigate towards improving it
I’d love to hear from you what questions remain, what you’re trying, and what seems to be working or not.
If you’d like me to come talk to your team or company about measuring for flow, please send me an email at steve@visible.is!
Bonus: If you’ve read this far, check out the deck that inspired the post here